3 รูปแบบกราฟราคาที่ใช้ในการวิเคราะห์ทางเทคนิค
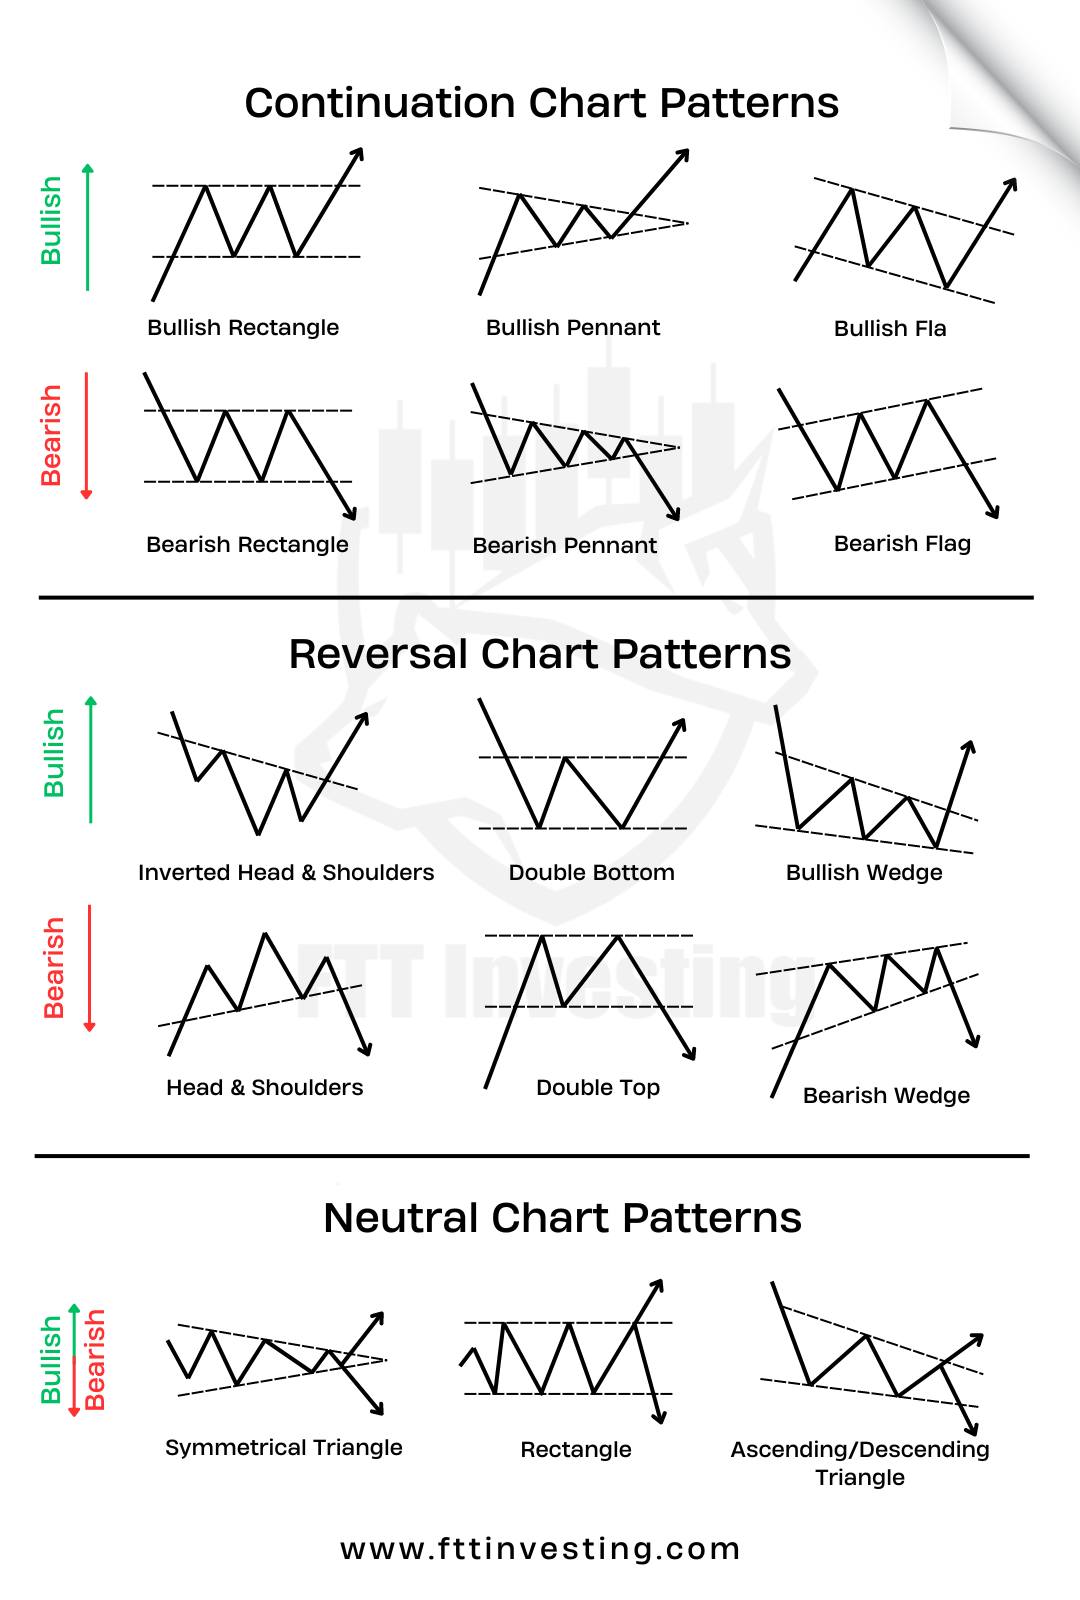
3 รูปแบบกราฟราคาที่ใช้ในการวิเคราะห์ทางเทคนิคมีดังนี้:
![📈](https://static.xx.fbcdn.net/images/emoji.php/v9/t1/1/16/1f4c8.png)
![▪️](https://static.xx.fbcdn.net/images/emoji.php/v9/t4c/1/16/25aa.png)
![🔄](https://static.xx.fbcdn.net/images/emoji.php/v9/t91/1/16/1f504.png)
![▪️](https://static.xx.fbcdn.net/images/emoji.php/v9/t4c/1/16/25aa.png)
![⚖️](https://static.xx.fbcdn.net/images/emoji.php/v9/ta/1/16/2696.png)
![▪️](https://static.xx.fbcdn.net/images/emoji.php/v9/t4c/1/16/25aa.png)
รูปแบบเหล่านี้ใช้ในการพยากรณ์ทิศทางของราคาตามสถานการณ์ที่เกิดขึ้น หากเข้าใจและใช้ประโยชน์ได้อย่างถูกต้อง จะช่วยในการตัดสินใจซื้อขายได้อย่างมีประสิทธิภาพมากขึ้น![📈](https://static.xx.fbcdn.net/images/emoji.php/v9/t1/1/16/1f4c8.png)
![💹](https://static.xx.fbcdn.net/images/emoji.php/v9/te3/1/16/1f4b9.png)
![📈](https://static.xx.fbcdn.net/images/emoji.php/v9/t1/1/16/1f4c8.png)
![💹](https://static.xx.fbcdn.net/images/emoji.php/v9/te3/1/16/1f4b9.png)
No Comments